
Snowflake Semantic Views for Power BI, Excel, and AI

If you’ve worked in analytics long enough, you’ve heard this. Finance calculates total revenue using a measure defined in their BI tool. Marketing has their own Excel formula that includes promotional credits. The data science team wrote a Python script that excludes returns. Three teams, three tools, three different answers to the same question.
This isn’t a technical problem, it’s an organizational one. When every downstream tool defines its own metrics, inconsistency is inevitable. And it gets worse: as AI-powered analytics tools emerge, each one will need its own metric definitions too.
What if you could define a metric once, in your data platform, and have every tool; Power BI, Excel, Cortex Analyst, Snowflake Intelligence, and AI Agents automatically use the same calculation?
That’s the promise of Snowflake Semantic Views. And I’ve built a custom Power BI connector to help make it real.
When “Total Revenue” Means Three Different Things
The root cause? Each tool has its own calculation logic:
Power BI: A DAX measure that sums
Order_Totalfrom the Orders tableExcel: A formula that adds promotional credits to capture “gross revenue”
Python: A query that excludes pending returns because “they’re not really revenue yet”
Nobody is wrong, they’re just answering slightly different questions. But when they all call it “Total Revenue,” confusion and mistrust follow. The board meeting devolves into a debate about whose numbers are “right” instead of discussing what to do about them.
This manifests technically too. In Power BI, the notorious “fan-out problem” occurs when aggregating across one-to-many joins. Join Orders to LineItems and sum order totals, each order gets counted multiple times, inflating your numbers by 3-4x.
Experienced Power BI developers know workarounds, but they’re all compromises:
SUMX with VALUES: Works in Import mode, but DirectQuery imposes a 1 million row limit
Bridge tables: Solve many-to-many relationships, not fan-out
Aggregate tables: Create maintenance nightmares and data duplication
The real solution isn’t better workarounds. It’s defining metrics at the source.
Metrics Belong in the Data Platform
The “shift left” movement in data engineering has transformed how we think about data quality, testing, and transformation. We moved data validation from dashboards to dbt tests. We moved data cleaning from Excel to SQL transformations. It’s time to apply the same thinking to semantics.
When you define a metric in Snowflake instead of DAX or Excel:
Version control: Semantic changes are tracked in Git, reviewed in pull requests, and deployed through CI/CD
Governance: One cental definition,, used by everyone, no more “which Revenue measure should I use?”
Propagation: Change the calculation once, and every downstream tool gets the update automatically
Documentation: Metric definitions live alongside the data, not buried in a Power BI file
This is what Snowflake Semantic Views enable. Define your business logic in the data platform, and let every consumer, Power BI, Excel, Python, AI agents, inherit the same definitions automatically.
The Solution: Snowflake Semantic Views + Custom Power BI Connector
Snowflake Semantic Views let you define your data model with three column types that capture business meaning:
Dimensions: Attributes you group and filter by (Region, Product Category, Order Date)
Metrics: Pre-defined measures that aggregate correctly at their native grain (Total Revenue, Average Order Value, Customer Count)
Facts: Row-level attributes representing specific business events or transactions. Facts capture “how much” or “how many” at the most granular level and typically serve as building blocks for constructing dimensions and metrics (LineItem Quantity, Discount, Price).
When you query a semantic view, the AGG() function tells Snowflake: “aggregate this metric at its defined grain level, regardless of how I’m slicing the results.” Snowflake handles de-duplication automatically, no fan-out, no inflated totals.
The challenge is that Power BI generates standard SQL with SUM() and AVG(). It doesn’t know about AGG(). That’s where my custom connector comes in. It intercepts Power BI’s queries and transparently rewrites them:
-- Power BI generates:
SELECT "MARKET_SEGMENT", "ORDER_YEAR", SUM("TOTAL_EXTENDED_PRICE")
FROM semantic_view GROUP BY 1, 2

-- Connector transforms to:
SELECT "MARKET_SEGMENT", "ORDER_YEAR", AGG("TOTAL_EXTENDED_PRICE")
FROM "TPCH_RICH_DB"."TPCH_RICH_SVS"."SV_SALES_ANALYSIS" GROUP BY 1, 2
Power BI receives correct results without knowing anything changed. DirectQuery works seamlessly, and your totals finally match your source system.
The same semantic view powers everything. Cortex Analyst and Snowflake Intelligence uses it for natural language queries. Python notebooks query it directly. AI agents inherit the same business definitions. Define once, query anywhere.
One Definition, Every Consumer
This is where the strategic value becomes clear. A semantic view isn’t just a Power BI fix, it’s your organization’s shared language for metrics.
Power BI: DirectQuery with correct aggregations via this custom connector. No fan-out, no workarounds. Business users drag and drop fields; the connector handles the complexity.
Excel: Finance teams can use Analyze in Excel to create PivotTables connected to the same semantic view. They get their familiar tool with governed metrics, no more rogue spreadsheets with different calculations.
Cortex Analyst: Business users ask natural language questions like “What was total revenue by region last quarter?” and get answers using your defined metrics, not hallucinated calculations. The AI is grounded in your business definitions.
Snowflake Intelligence & Cortex Agents: AI agents building automated analyses inherit consistent business definitions. When an agent reports on revenue to your Slack channel, it uses the same calculation as your CFO’s dashboard. No more “which revenue number is this?”
Python & Notebooks: Data scientists can query semantic views directly, ensuring their models train on the same metric definitions used in production dashboards. No more drift between ML features and BI metrics.
Other BI Tools: Any tool that can query Snowflake can consume semantic views*, semantic layer isn’t locked to one vendor. *Check your BI Tool for native connectivity with Snowflake Semantic Views and/or participation in the Open Semantic Interchange Initiative.
How It Works: Power BI Walkthrough
Let me show you the actual user experience in Power BI.
Step 1: Connect to Snowflake Semantic Views
In Power BI Desktop, click Get Data and search for “snow”. Select Snowflake Semantic Views (Beta):
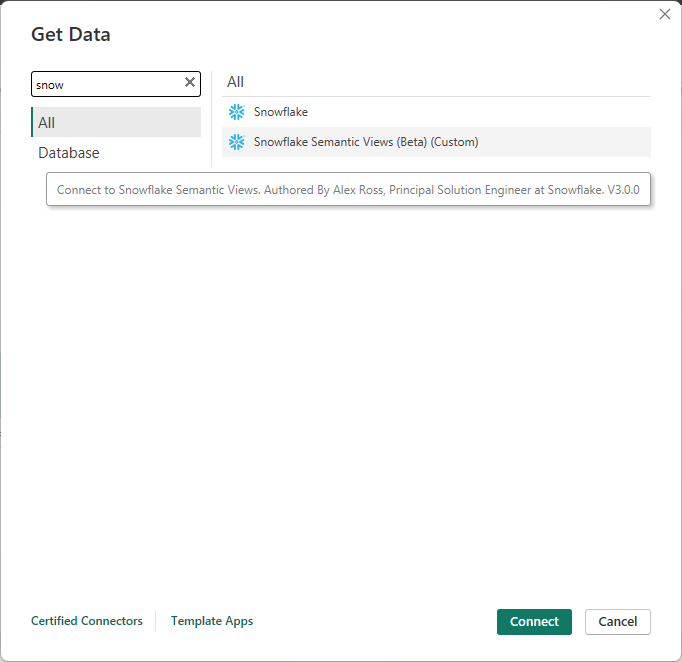
The connector supports multiple authentication methods: PAT tokens for service accounts, key-pair authentication for maximum security, and OAuth/Microsoft Account for seamless Azure AD integration.
Step 2: Navigate to Your Semantic View
The Navigator displays your Snowflake databases, schemas, and semantic views in a familiar tree structure:
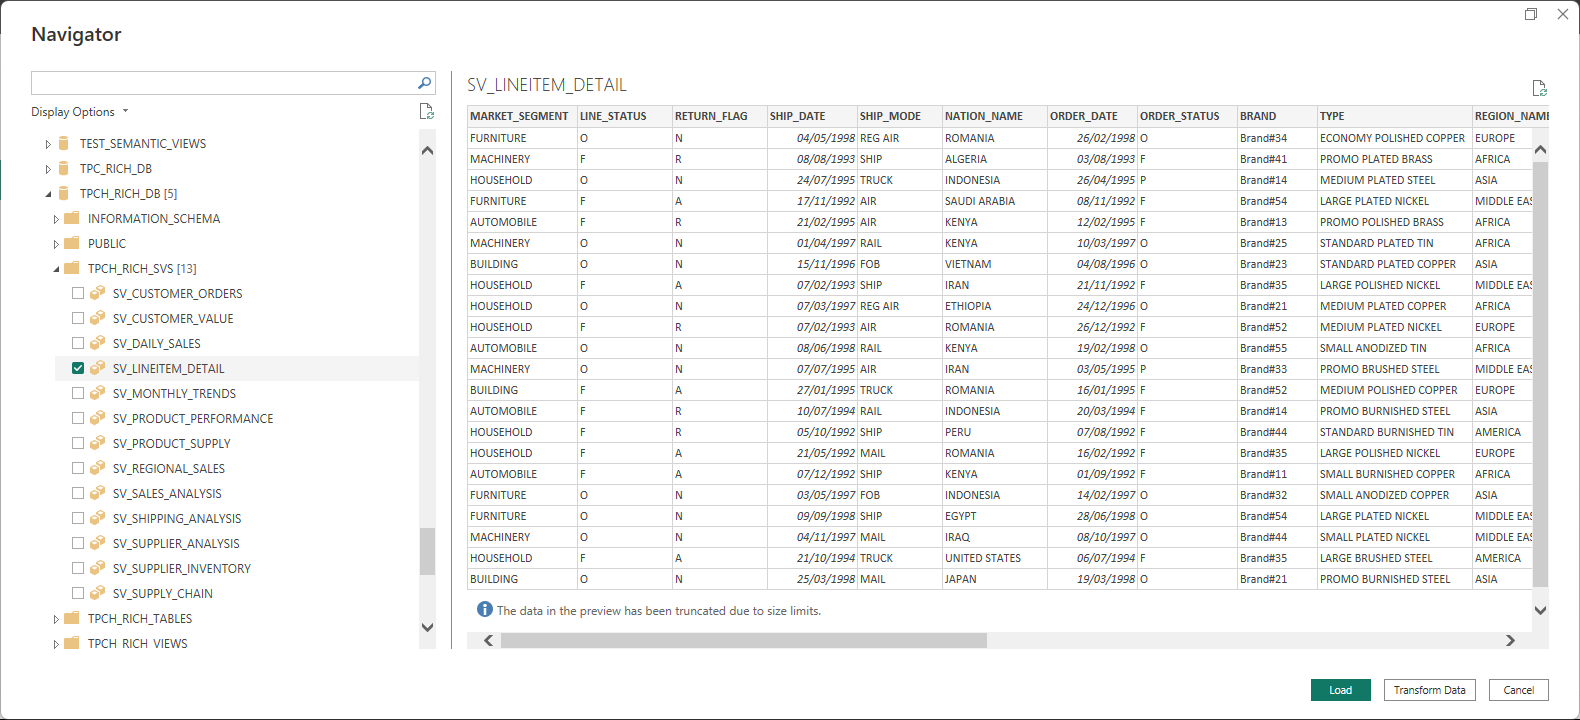
Select your views and click Load for DirectQuery. The experience is identical to any other database connector, no new paradigms to learn.
Step 3: Build Your Report
Build your report as usual, drag dimensions to axes, metrics to values. The status bar confirms DirectQuery mode:
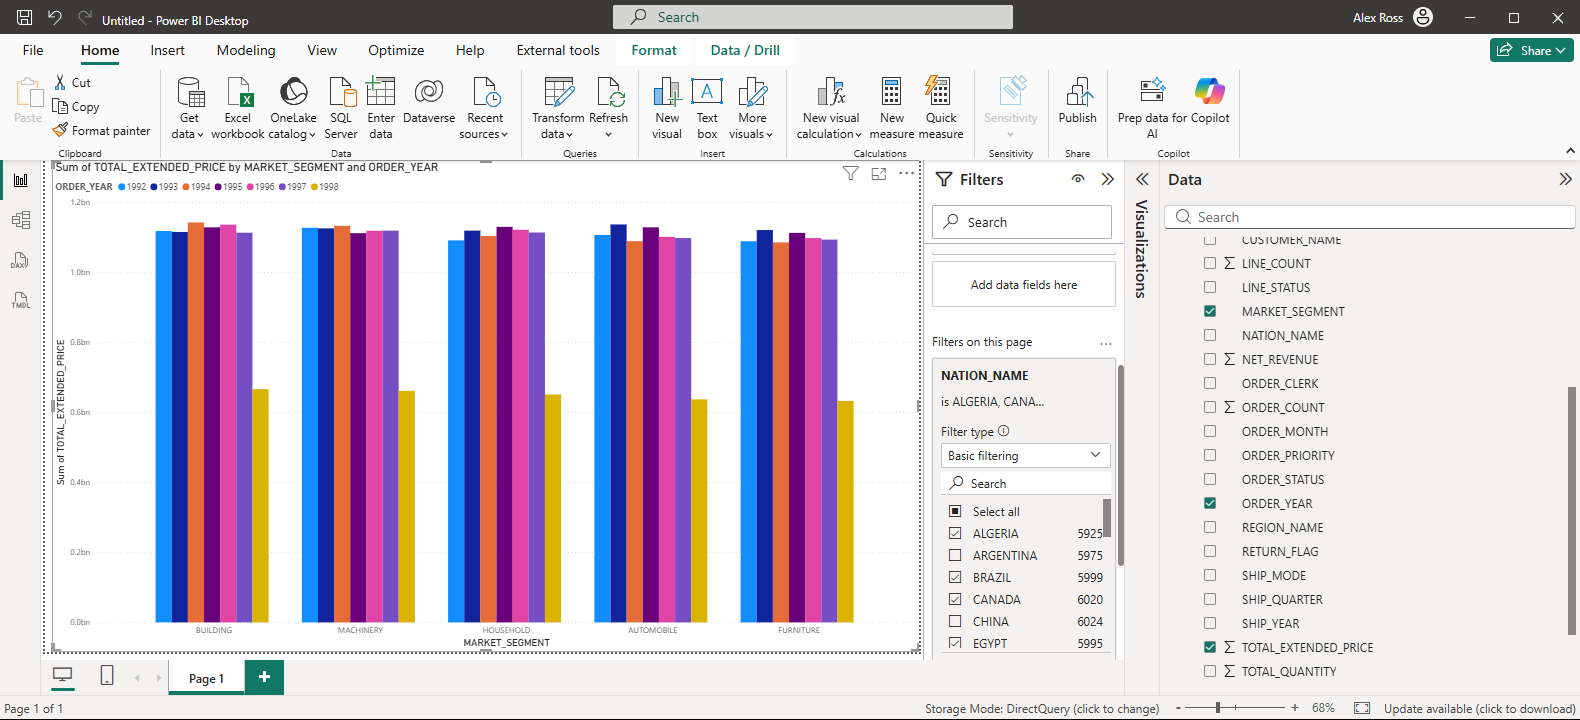
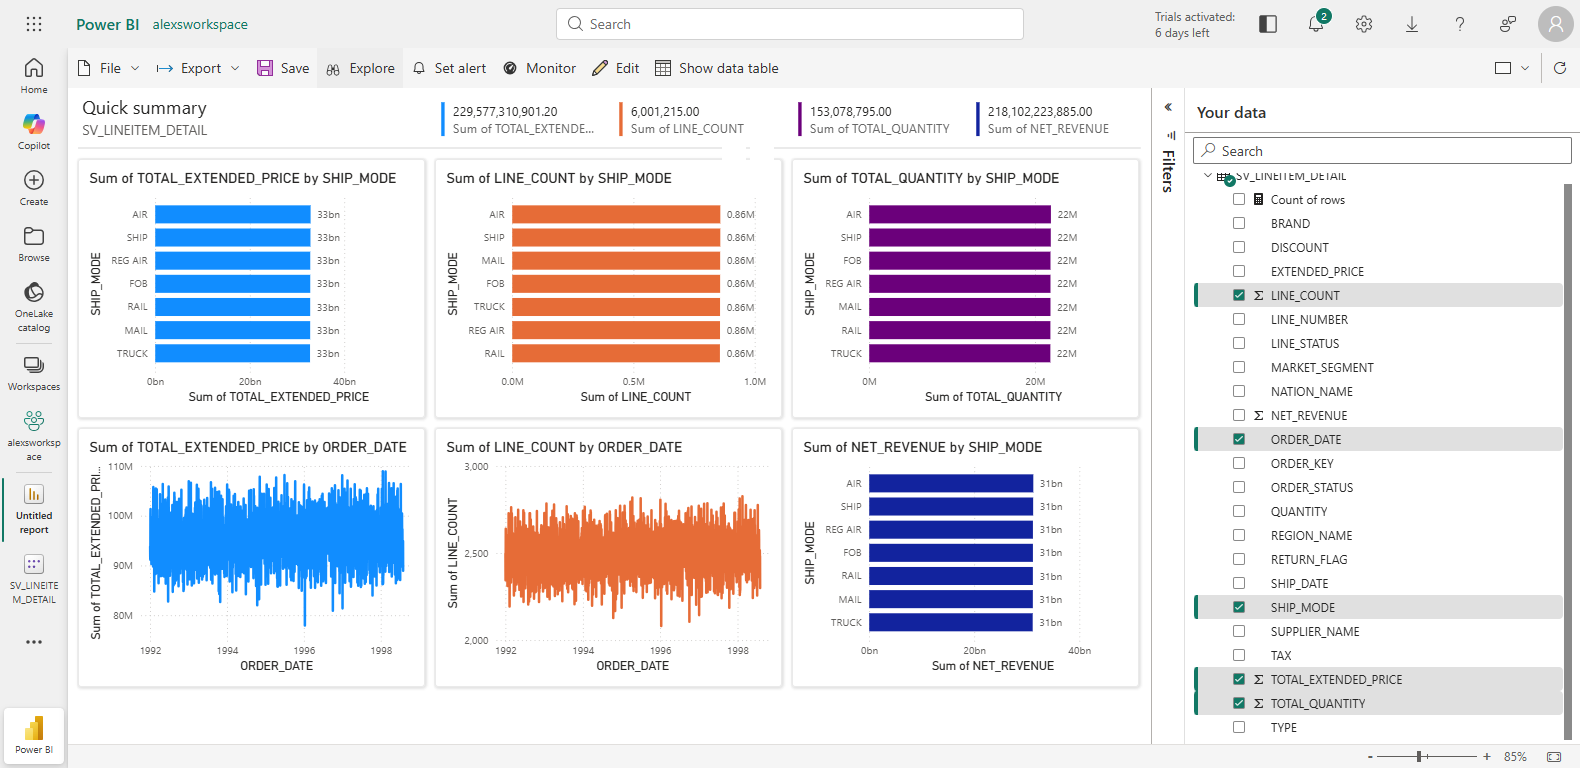
This report shows Total Extended Price by Market Segment and Order Year, filtered to specific countries. With standard SQL, this would inflate by 3.5x due to fan-out. With semantic views, the numbers are correct.
Step 4: Verify in Snowflake
Check Snowflake Query History:
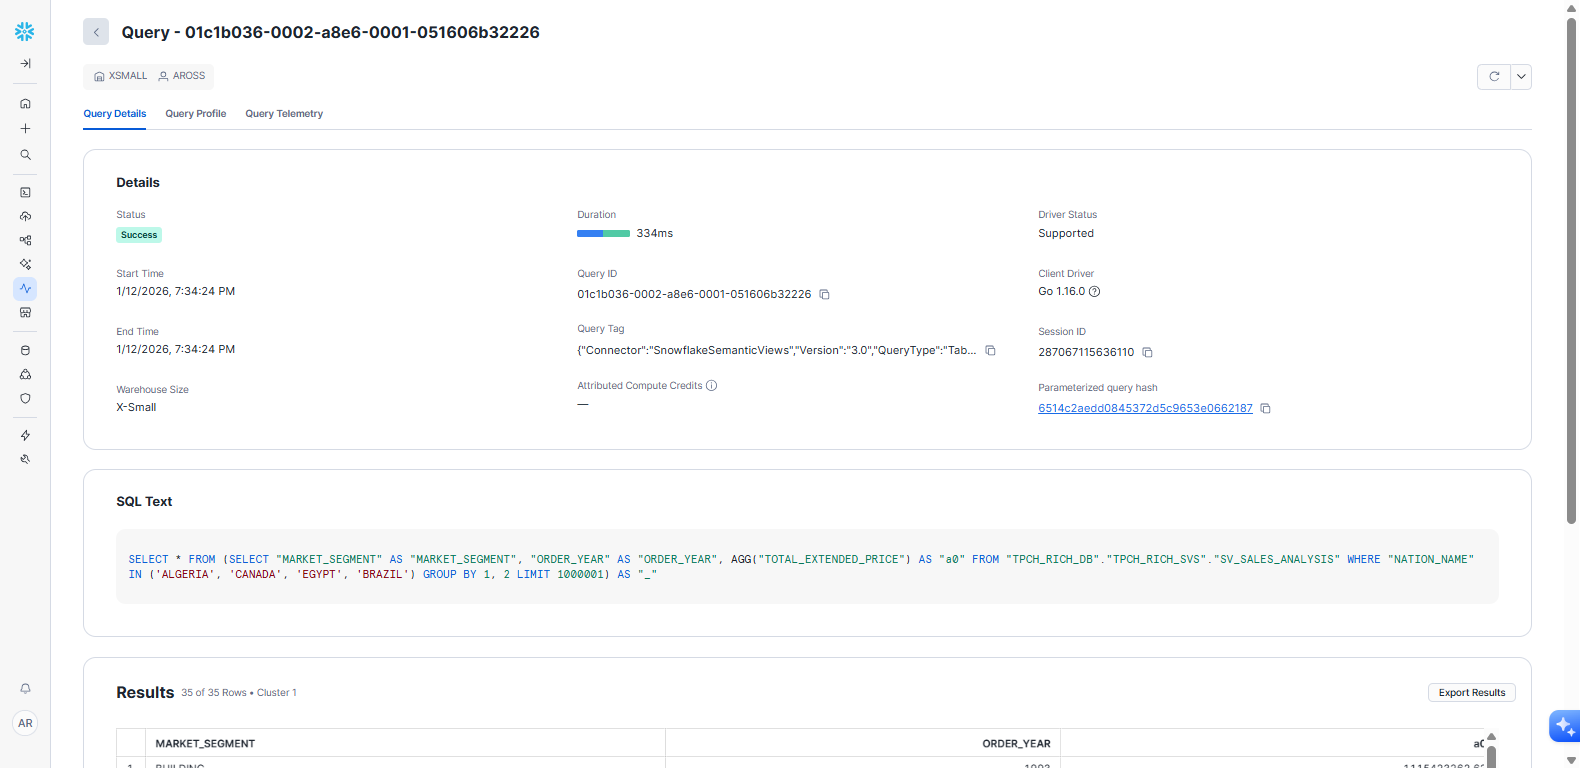
The SQL Text section and you’ll see AGG("TOTAL_EXTENDED_PRICE") instead of SUM().
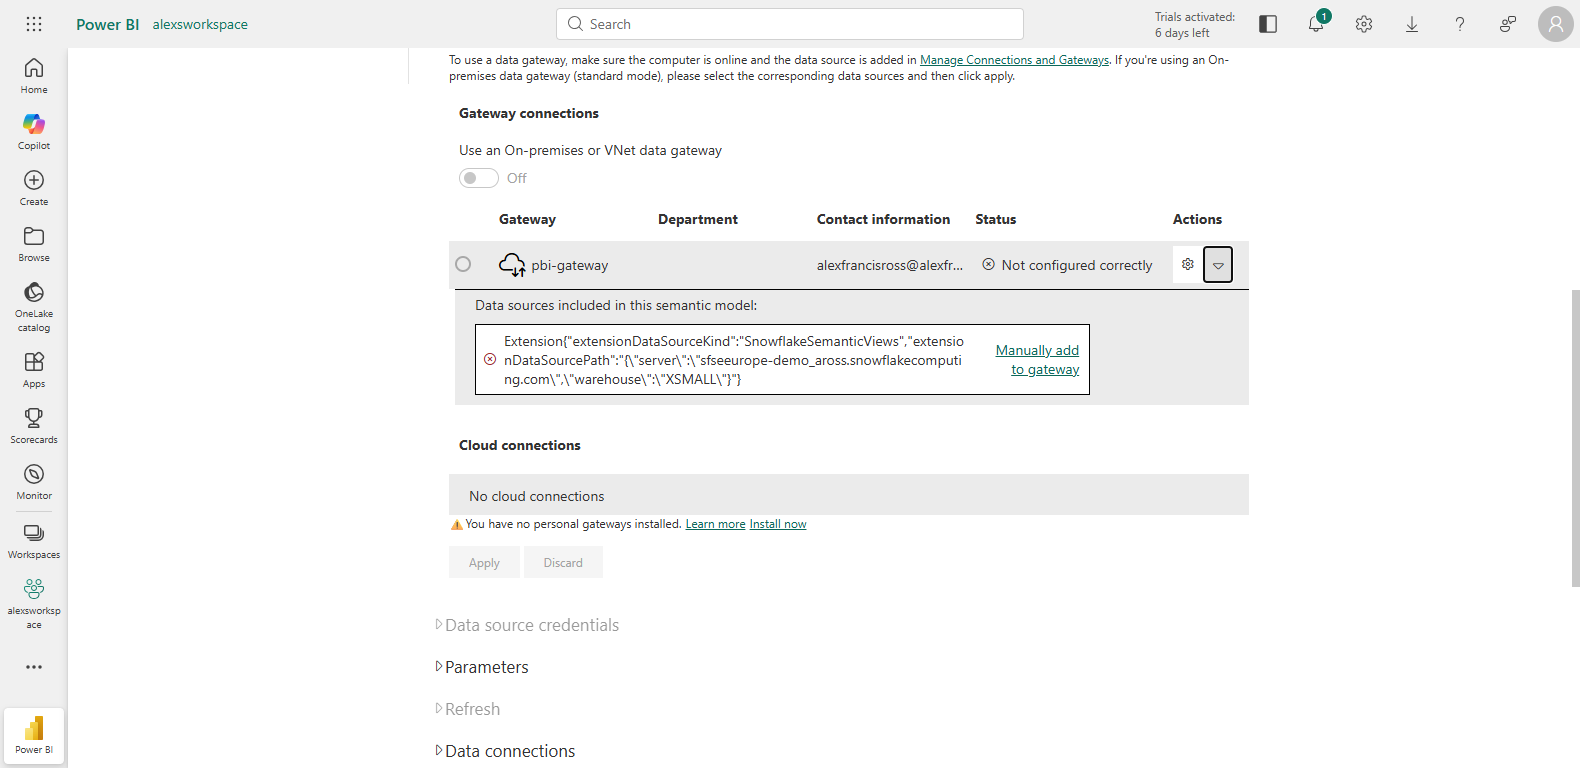
Power BI Service & Gateway
The connector works with the On-Premises Data Gateway for enterprise deployment. Deploy the .mez file to your gateway’s “Custom Connectors” folder:
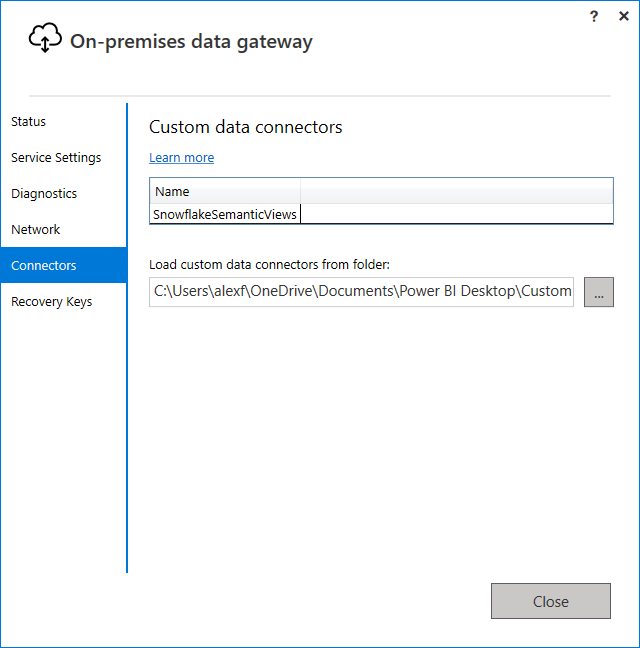
Configure credentials in Power BI Service, and your semantic view reports are ready for the organization:
Beyond Power BI: Excel Integration
For finance teams who live in Excel, the Analyze in Excel feature in the Power BI Service brings semantic views to their familiar environment:
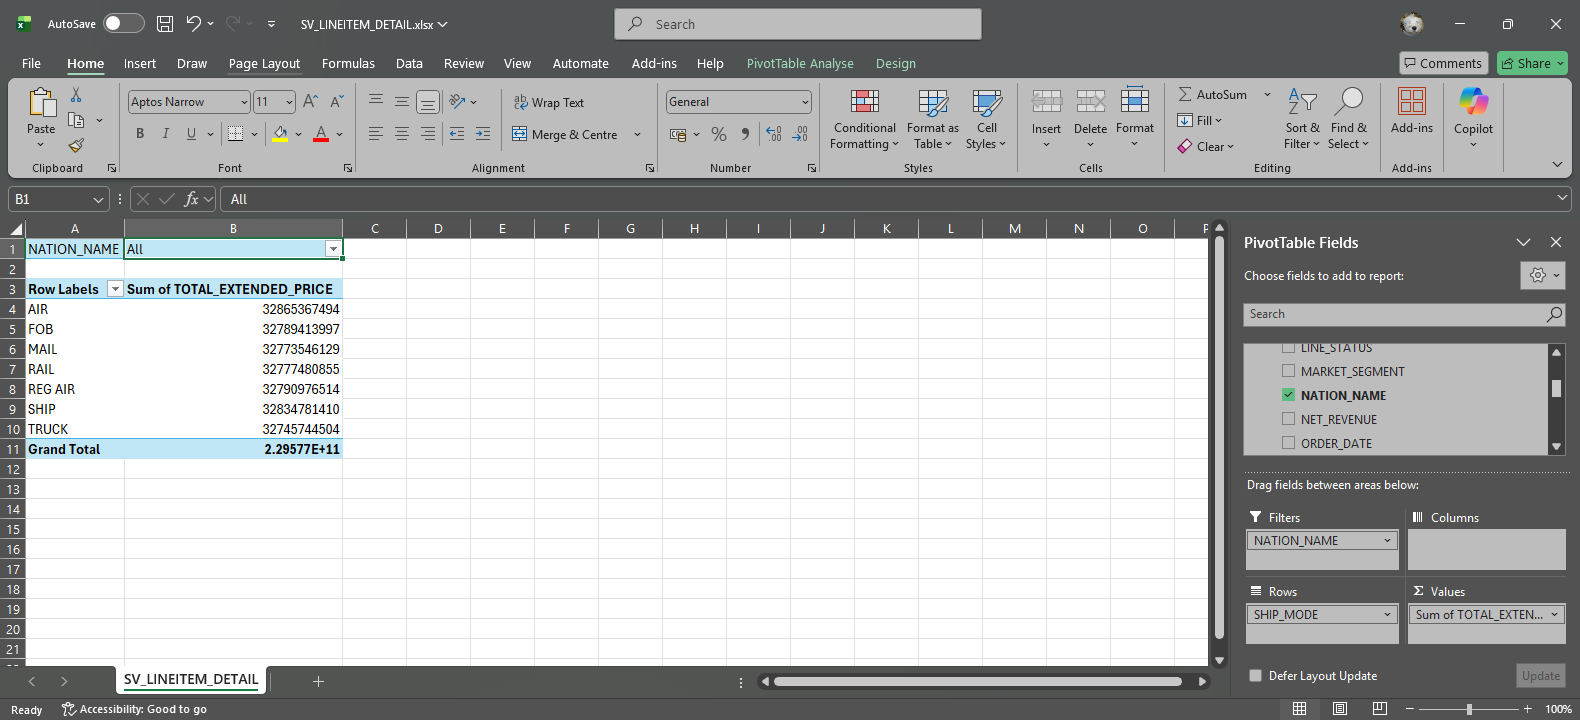
Same metrics, same definitions, but in a PivotTable. When the CFO drags “Total Revenue” into their Excel analysis, they get the exact same calculation as the Power BI dashboard. No more reconciliation headaches. No more “let me check my spreadsheet” moments in board meetings.
This is particularly powerful for ad-hoc analysis. Users can slice and dice data however they want, confident that the underlying metrics are correct and consistent with every other tool in the organization.
Important: Analyze in Excel connects to a Power BI semantic model, not directly to Snowflake. You’ll need to:
Publish your Power BI report to the Power BI Service
Configure the gateway connection (see Gateway section above)
Use “Analyze in Excel” from the published dataset in Power BI Service
PBIT Generator: From Snowflake to Power BI in 3 Easy Steps
What if your Semntic Model in Power BI consists of more than just a Snowflake semantic view? For complex scenarios combining semantic views with regular tables / views, a companion Streamlit app generates ready-to-use Power BI templates.
Step 1: Review Selected Objects
Select the views, tables, and semantic views you want in your Power BI model:
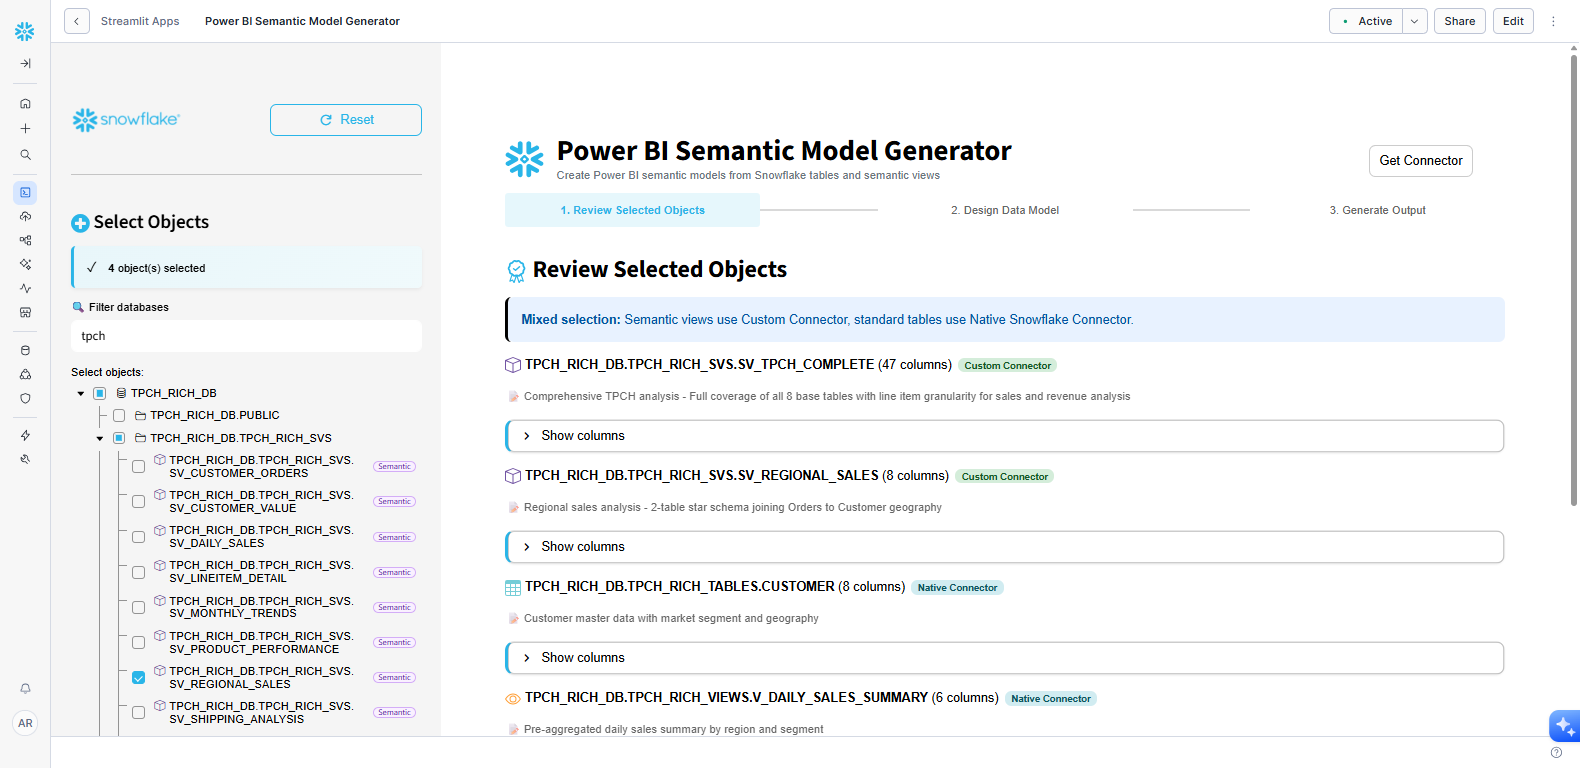
The app automatically detects object types and routes them appropriately: semantic views use the custom connector with AGG() support, while standard tables use Power BI’s native Snowflake connector. Filter by database name to quickly find what you need.
Step 2: Design Data Model
The visual model designer auto detects FK / PK contraints that have been defined in Snowflake, shows your selected objects and lets you configure relationships:
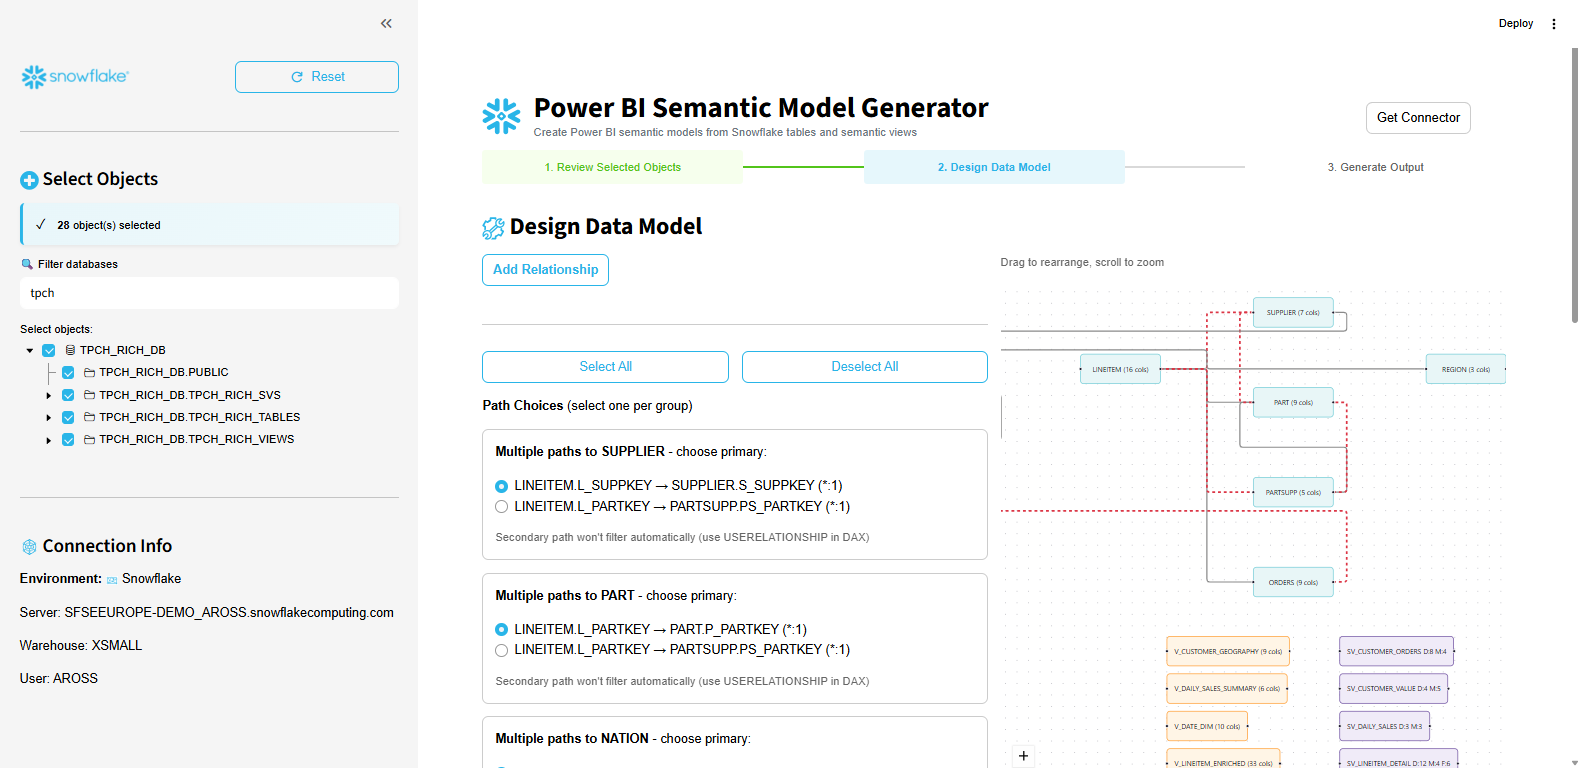
When multiple join paths exist between tables, choose the primary relationship. Secondary paths can be configured using USERELATIONSHIP in DAX. Drag tables to rearrange, scroll to zoom, and add custom relationships as needed.
Step 3: Generate Output
Configure your output and download:
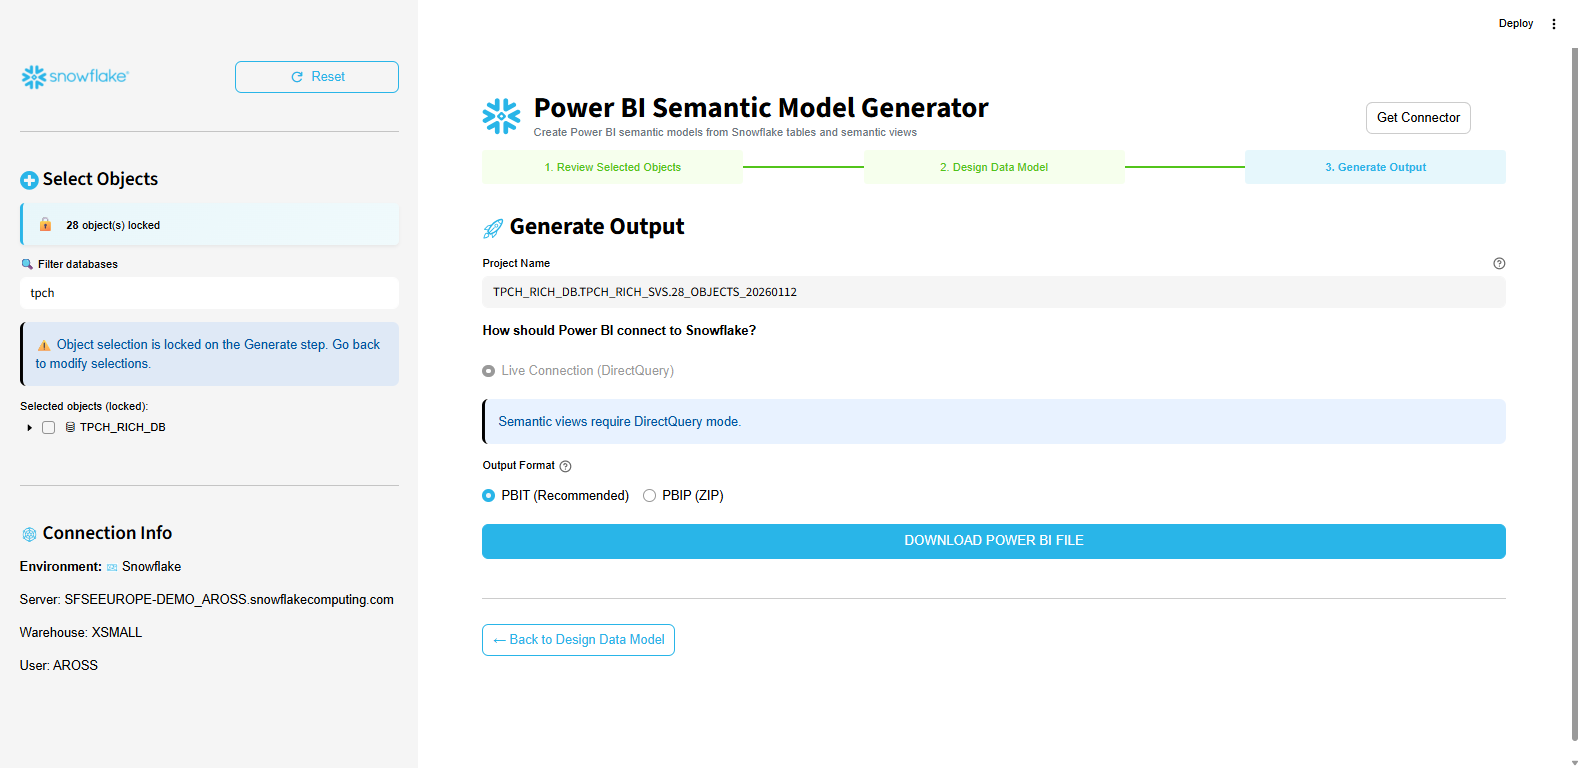
DirectQuery mode is enforced for semantic views (required for AGG() to work correctly). Choose between PBIT format (recommended) or PBIP (ZIP). Click download to get your ready-to-use Power BI template.
The generator automatically pulls table and column comments from Snowflake and pushes them into the Power BI model as descriptions. Your data catalog documentation flows directly into Power BI, no manual copying, When analysts hover over a field in Power BI, they see the same description your data engineers wrote in Snowflake.
Getting Started
Prerequisites:
Power BI Desktop (any recent version)
Snowflake account with semantic views defined
Windows machine (Mac users can run Power BI in Parallels or VMware)
Installation (MSI - Recommended):
Download the
.msiinstaller from GitHubRun the installer - it automatically deploys the connector and configures Power BI settings
Restart Power BI Desktop
Installation (Manual):
Download the
.mezfile from GitHubCopy to:
Documents\Power BI Desktop\Custom Connectors\(create the folder if needed)In Power BI Desktop: File → Options → Security → Allow uncertified connectors
Restart Power BI Desktop
For comprehensive documentation, including semantic view creation guides, authentication setup, and troubleshooting, visit the GitHub repository.
Future-Proof Your Analytics
The analytics landscape is changing fast. AI-powered tools like Snowflake Intelligence and autonomous agents will soon be as common as dashboards. Each one needs consistent metric definitions, or you’ll have the “three different revenue numbers” problem multiplied across every new tool you adopt.
Semantic views are your investment in that future. Define your metrics once, in Snowflake, and every tool, current and future, inherits the same business logic. This custom connector brings Power BI into that vision today.
It’s not just about fixing fan-out or making DirectQuery work. It’s about building a semantic layer that serves your entire analytics and AI ecosystem: dashboards, spreadsheets, AI analysts, and whatever comes next. When the next breakthrough analytics tool arrives, your semantic layer will be ready.
Try it yourself: github.com/alexfrancisross/snowflake-semantic-views-powerbi
Found a bug? Have a feature request? Open an issue on GitHub.
Alex Ross is a Principal Solution Engineer at Snowflake and author of Cloudy Data.
I couldn't agree with you anymore. I have the exact same thought and I was literally asking claude how to connect power bi to my newly created semantic view and there you were!
Option 1: Custom Connector (Best for native semantic view support)
There's an open-source Power BI custom connector on GitHub (snowflake-semantic-views-powerbi) that brings Snowflake Semantic Views directly into Power BI with full DirectQuery support — querying your semantic layer in real time without data extracts or imports. GitHub
Like a knight in shinning armour! Thank you very much for your contribution looking forward to trying it tomorrow.
Cheers from downunder!