Tableau & dbt: Governed Self-Service Analytics
Introduction
I've seen an explosion in organisations adopting dbt alongside Tableau over the past couple of years. In recognition of this trend, I’ve become involved in bringing together these two passionate data communities to share their collective knowledge regarding how Tableau & dbt can help to deliver self-service with governance on the modern data stack.
If you are interested in learning more about this topic then I encourage you to take a look at our first meetup event where we spoke about some use cases and best practices:
One of the key talking points in my introduction focused on how using the two tools together provides balance between the self-service and visual exploration capabilities in Tableau and robust, centralized data governance in dbt. Specifically, using dbt alongside Tableau introduces github for version control, provides more comprehensive documentation and lineage regarding data transformations that are happening inside the cloud data platform (which Tableau would otherwise be unaware of), and encourages business logic to be pushed upstream instead of it being embedded in Tableau Prep flows, calculated fields, custom SQL etc.
Since running this event, I've had the opportunity to speak with many organisations running Tableau & dbt, and there are a few recurring themes and benefits I've heard about:
Benefit 1: Metadata Exchange
The most sought-after capability is a request to surface dbt metadata in the Tableau Catalog to help the analyst and end-user community better understand the context and meaning behind the data transformations that took place in dbt. In my experience there is often a disconnect between data engineering and analytics teams within an organisation, and seamlessly sharing this metadata can be a great way to help break down these barriers.
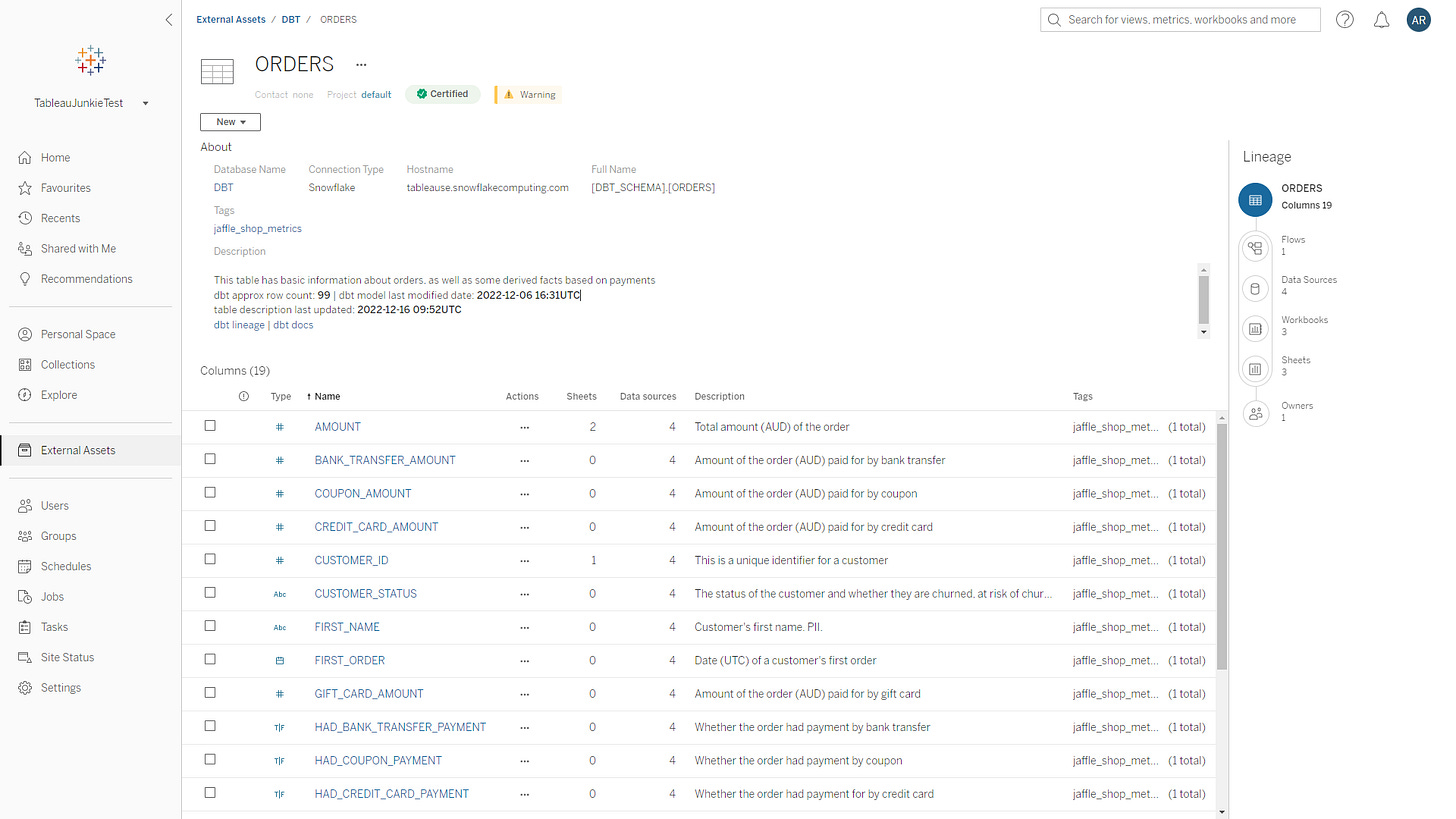
In light of this highly requested feature, I’ve written a Python-based integration (available on github here) that demonstrates how it is possible to connect the dbt Cloud Metadata API and Tableau Catalog (using Tableau’s GraphQL API and REST API) to improve trust in the analytics experience for both dbt and Tableau users. The integration works by creating a link between the dbt models and downstream Tableau data sources that reference generated database tables before exchanging metadata between the two products.
dbt packages include rich documentation and lineage information, and analytics engineers (AEs) are far more likely to populate meaningful field descriptions and documentation as they develop these packages vs. other Enterprise Data Catalogues (EDCs) that rely on AEs retrospectively populating this information after their project has been put into production. These other EDCs often rely on manual data entry, holding developers responsible for updating the catalog as data assets evolve which leads to partial completion and is not a task that is relished by AEs who would rather focus their time and attention solving analytical problems that help move the needle.
In order to realize the full value of the metadata stored in dbt, the integration surfaces it via the Tableau Catalog to be shared with a much wider community. Populating the Tableau Catalog with dbt metadata results in Tableau users gaining more trust in the data they are consuming through easy access to automatically generated table/field descriptions, data quality warnings, certifications, tags and more.
In parallel, dbt developers are able to perform better impact analysis via automatically generated Tableau Dashboard Exposures that the integration adds to their DAGs and helps them understand what Tableau content will be affected if/when they make updates or changes to their dbt models.
At the time of writing, the integration has only been tested with Snowflake (although other data platforms should work). I welcome pull requests and/or feature enhancements that the user community suggests or people getting in touch with any questions about deploying the solution. I’ve also recorded the following demo which explains how the integration works in more detail:
dbt & Tableau Metadata Exchange video demo
Benefit 2: DataOps
DataOps is still a relatively new concept that encapsulates the application of software development practices to data assets development in a similar way that DevOps brought these concepts to operational IT departments. A better definition from Wikipedia describes DataOps as: a set of practices, processes and technologies that combines an integrated and process-oriented perspective on data with automation and methods from agile software engineering to improve quality, speed, and collaboration and promote a culture of continuous improvement in the area of data analytics.
In my opinion, there are a couple of key reasons why organisations should care about DataOps:
In 2016, Gartner redefined the Magic Quadrant for BI and Analytics to reflect the market disruption that was caused by modern BI platforms like Tableau. This shift in power from IT towards the business increased agility and speed to insight, but also meant that it became more difficult to build robust, repeatable, scalable data pipelines (historically built and maintained by IT) that support mode 1 style analytics.
We are now seeing an increased demand for data apps and data products that involve “shipping data like a product” and apply software engineering best practices to the way data and analytics are delivered. I feel this will be an important part of the next wave of BI and Analytics that will require extremely well curated and modelled data and semantic definitions that power generative AI, Auto ML, LLMs, NLG/NLP etc. It’s still early days, but check out Dephi as a really interesting example of what is possible when OpenAI is used ontop of the dbt semantic layer.
Using dbt & Tableau helps organizations implement DataOps processes by creating reliable & reusable data pipelines that facilitate governed self-service on trusted data. dbt improves data quality through data testing and continuous integration features that enable validation of data assets before shipping. dbt also introduces version control to the data development cycle through integration with github. Without dbt, many of these DataOps processes have to be performed manually in Tableau which can become hard to govern effectively at scale.
Benefit 3: Performance & Cost
Another benefit is being able improve the performance of Tableau visualizations by physically materializing data in the cloud data platform and reducing the complexity of the SQL generated by Tableau. For example, one common performance gain can be realized by denormalizing the underlying tables, reducing the number of joins/relationships implemented in the Tableau data sources. Check out this video by Bethany Lyons which highlights the vast difference in performance which can occur when using a highly normalized model in Tableau vs. a denormalized model that was created in dbt.
This reduction in query execution time not only improves the end-user experience but also has a direct impact on the compute resources and costs associated with running your cloud data platform. In other words, applying these optimizations results in higher query throughput or the ability to scale down the warehouse size without impacting the overall performance. Not only this, but further cost reduction can be realized thorough the identification and consolidation of duplicate database tables / data models.
Voi published a case study on how to increase developer productivity, describing how they were able to significantly reduce their average query execution time and daily costs with dbt. And Smartsheet wrote about Founding an Analytics Engineering Team, describing how dbt helped them clean up their dashboard ecosystem and retire 50% of their workbooks.
Benefit 4: A Universal Semantic Layer
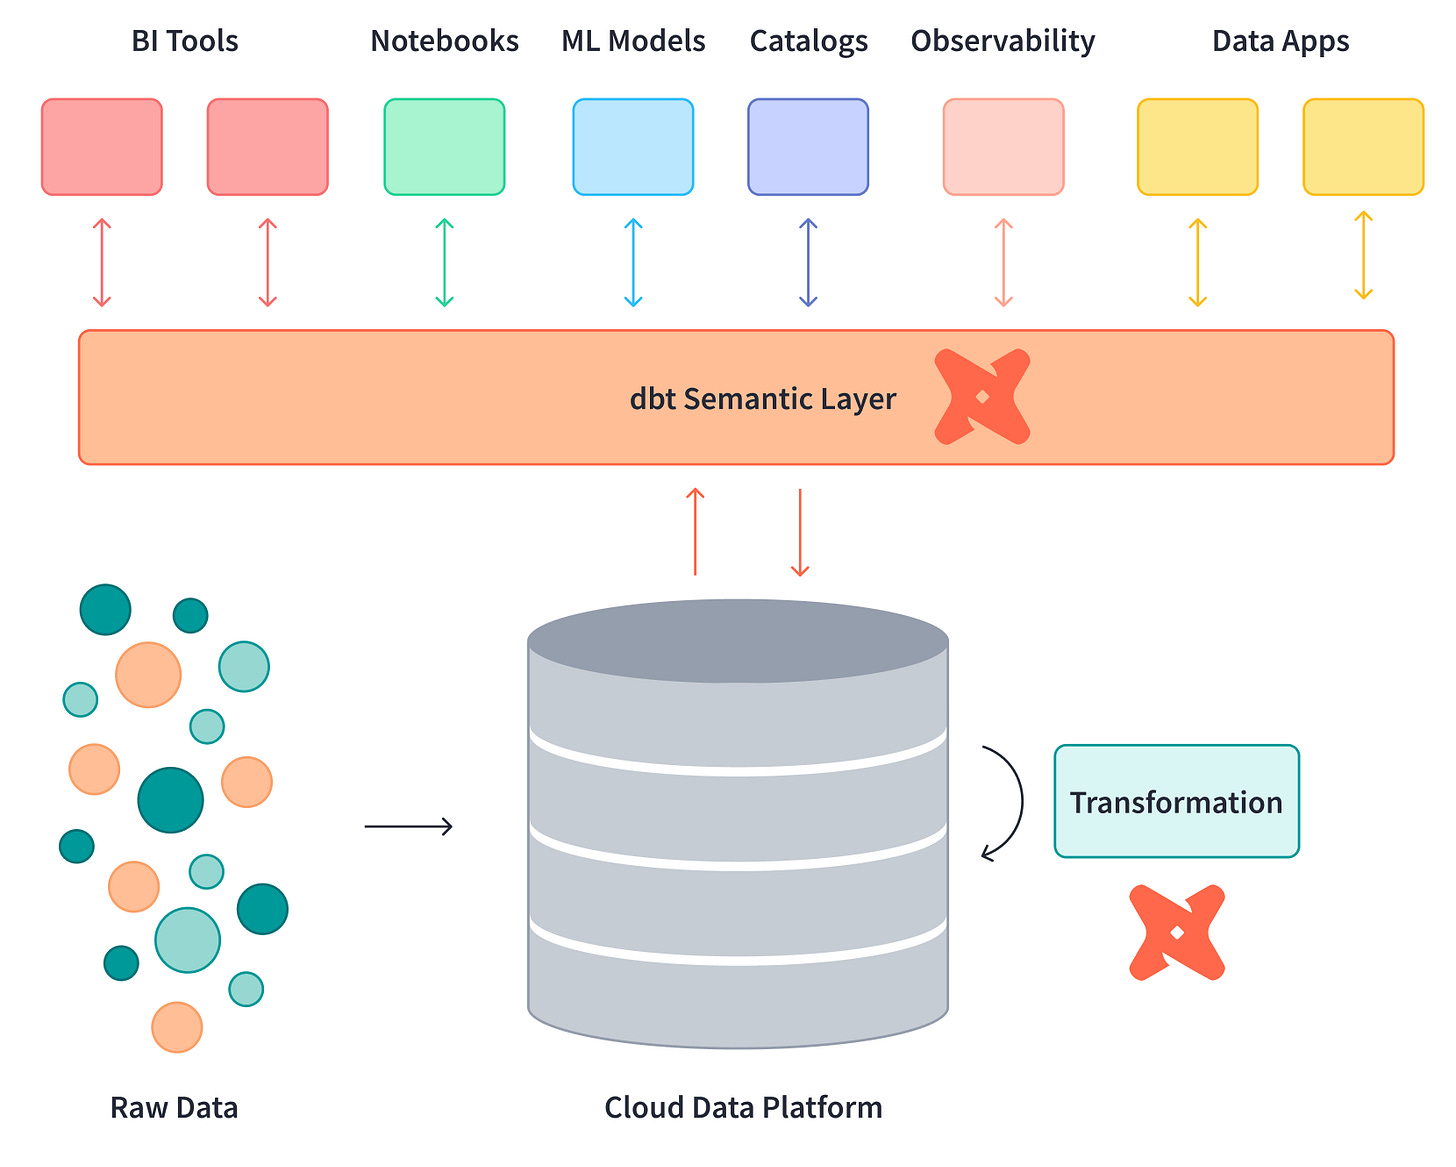
I've been closely following development of the dbt semantic layer since Drew Banin announced the metrics layer at Coalesce 2021. I am also really excited that dbt and Transform have now joined forces and I look forward to seeing how this helps to accelerate the maturity and development of the semantic layer beyond metrics. Whilst there is a lot of hype about “headless BI” and the semantic layer, there are still very few organisations (other than than the FANGs and Airbnb’s of the world) that have been able to successfully implement a centralized metric layer which is independent of the downstream BI tool or application as the engineering effort involved is often seen as outweighing the benefit. That said, there is a clear desire from most to move semantic logic “up the stack” and away from proprietary front-end BI tools.
The semantic/metrics layer space is evolving quickly with a number of emerging technologies and approaches. Whether we end up with an open standard or a single “winner” remains to be seen, but dbt is certainly one of the front runners for owning this market given they have become ubiquitous at providing the “T” in ELT, and organisations are already defining using dbt for much of their data transformation and business logic (including metric definitions). If dbt are able to go beyond just metrics and make it really simple for downstream BI tools and applications to integrate then why wouldn’t you implement their semantic layer and have a single framework that governs both the physical and logical data models in your cloud data platform?
As soon as the public preview launched in October 2022 I started playing with it to understand how Tableau users could benefit and dynamically query dbt metrics instead of being forced to chose whether they should physically materialize data at varying levels of detail in their cloud data platform (akin to going back in time and building multi-dimensional cubes) or embed metric definitions in calculated fields that only reside in Tableau Data Sources and Workbooks.
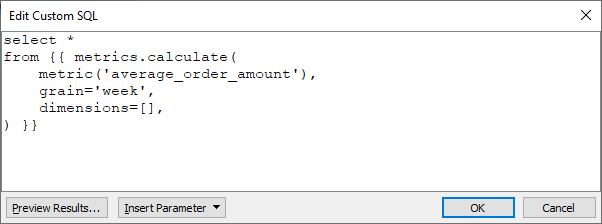
The good news is that dbt's semantic layer implementation acts as a transparent proxy server to Snowflake making it super simple to connect and authenticate using Tableau’s native Snowflake connector. However, the dbt semantic layer expects requests to be submitted using the metrics.calculate macro whereby dbt takes the request, translates it into SQL (based on the dbt metric definition) and returns the result set to Tableau. For example, to select from the average_order_amount metric, aggregated to the week level, we can use the following query:
select *
from {{ metrics.calculate(
metric('average_order_amount'),
grain='week',
dimensions=[],
) }}
Given that Tableau does not (yet) provide native support for 3rd party metrics layers such as dbt, we can instead paste this query as custom SQL as shown:
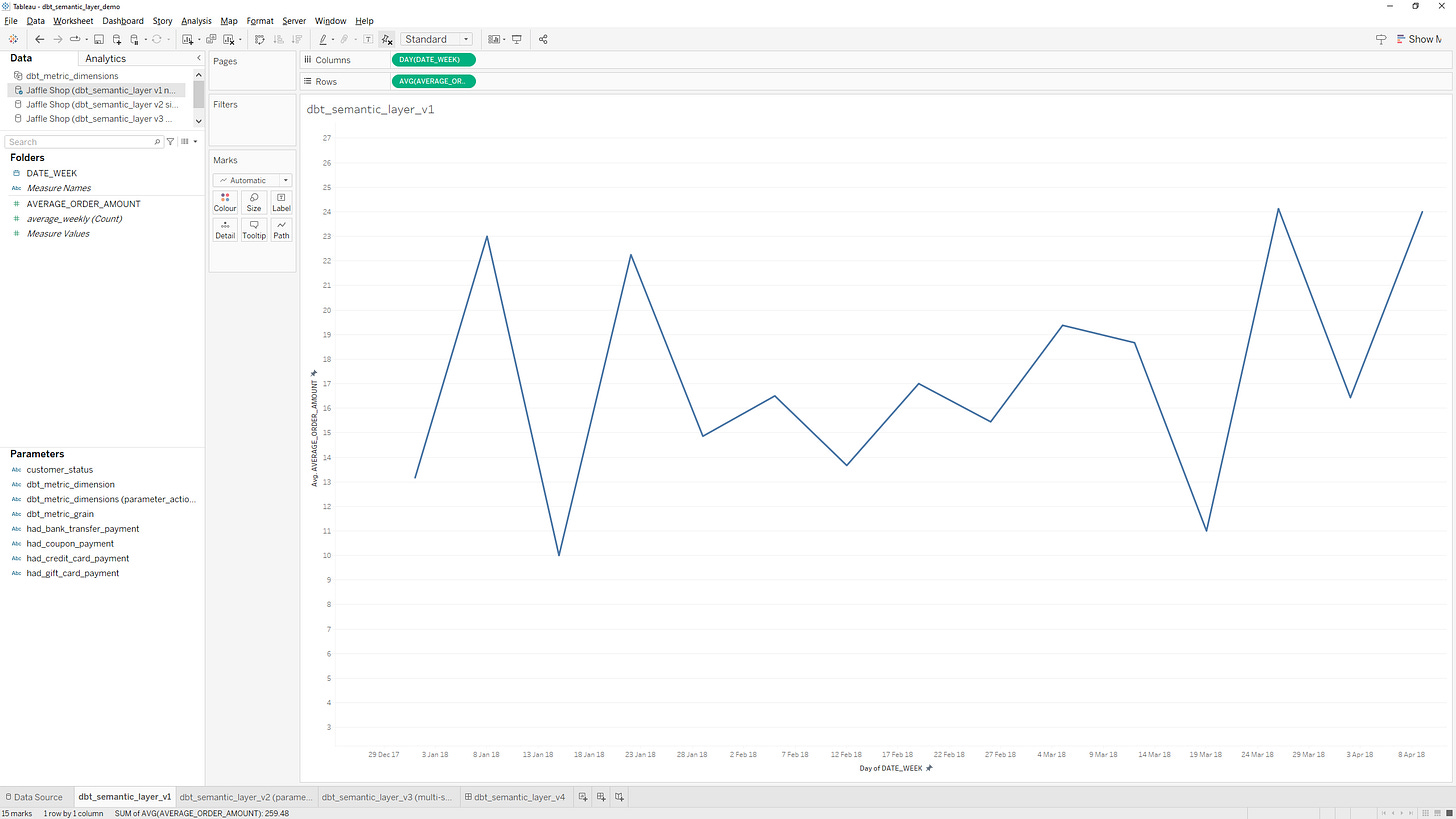
Once successfully connected to the metric, users can drag and drop in Tableau to build their viz but need to be careful to not change the level of detail given the weekly grain has been hard coded in the custom SQL:
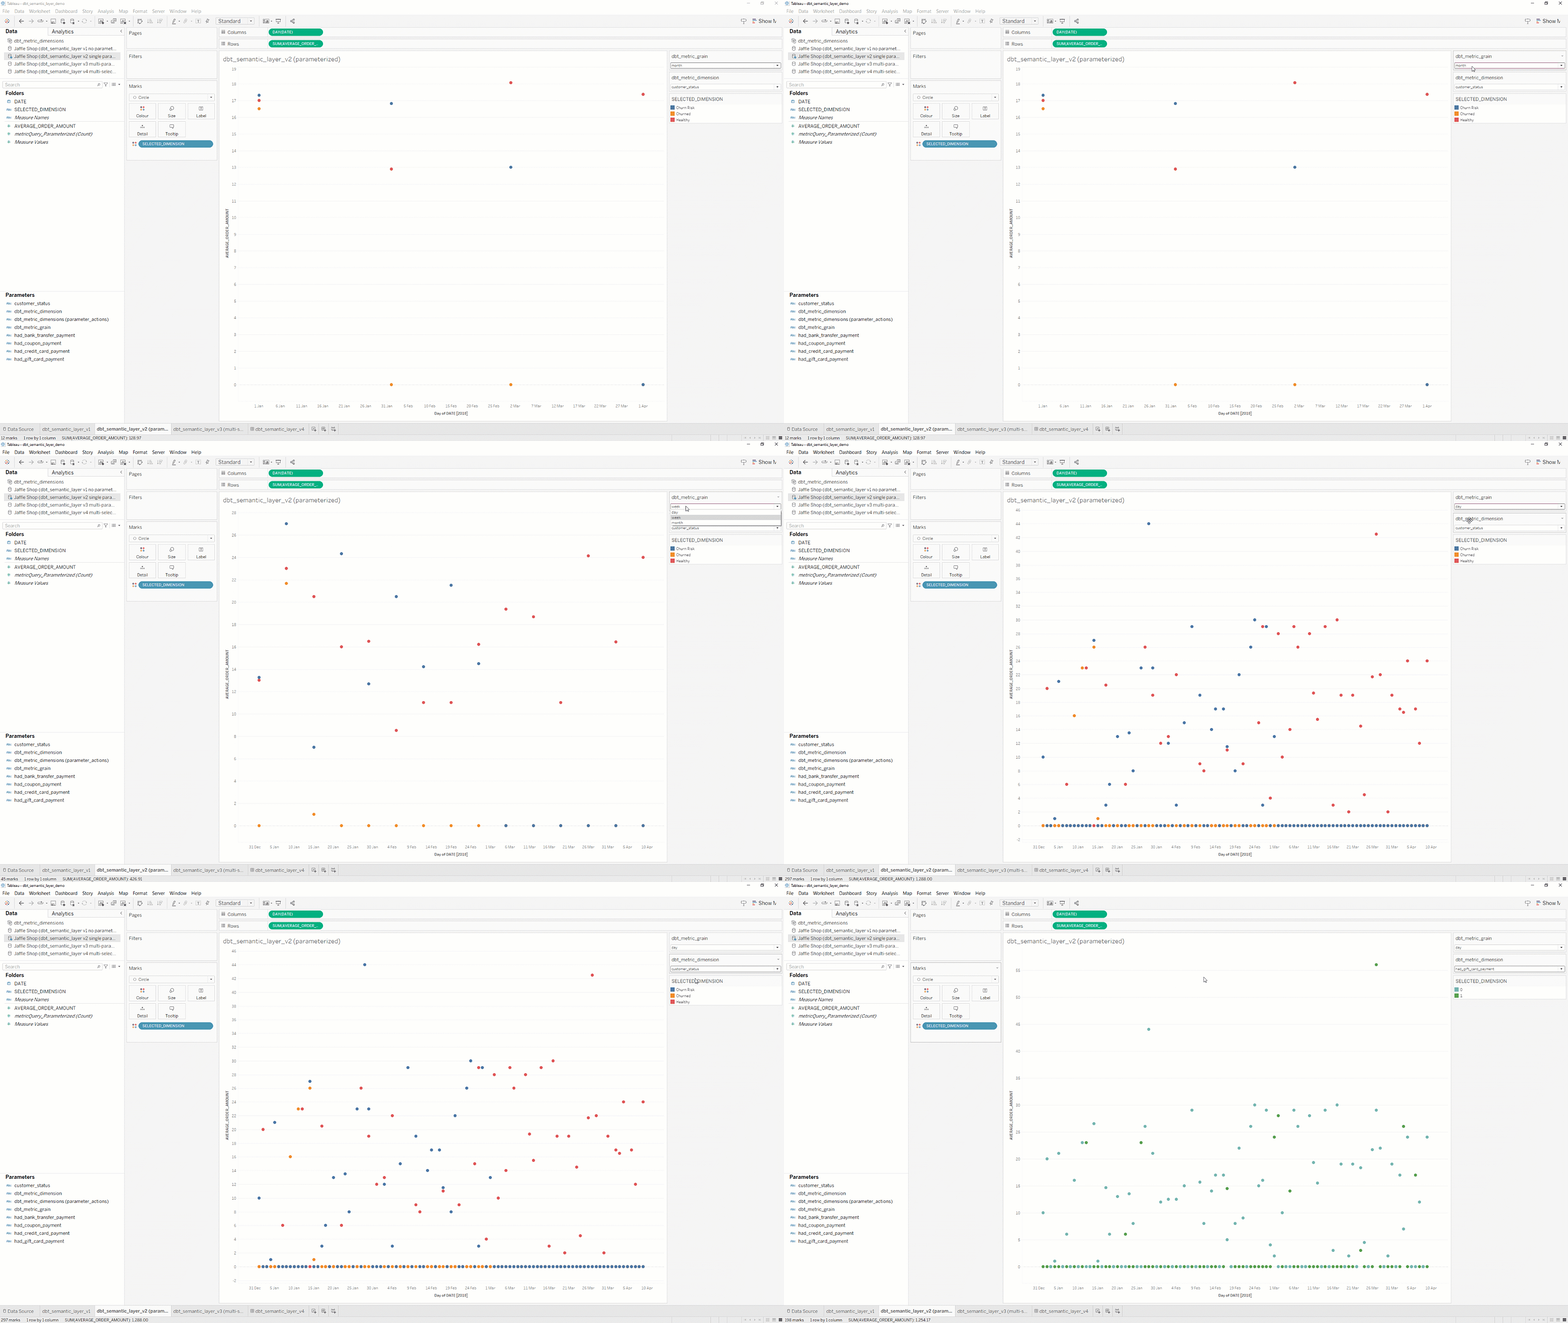
In order to provide more flexibility to Tableau users, parameters can be introduced to the custom SQL to allow end-user control over the grain and dimensions that are passed to the dbt metrics.calculate macro. For example, the following query sets the date_grain and dimension_param variables based on a Tableau parameter, avoiding the need to re-write the custom SQL every time the grain or dimensions change:
{% set date_grain=<Parameters.dbt_metric_grain> %}
{% set dimension_param=<Parameters.dbt_metric_dimension> %}
select
date_{{date_grain}} as date, average_order_amount, {{dimension_param}} as selected_dimension
from {{ metrics.calculate(
metric('average_order_amount'),
grain=date_grain,
dimensions=[dimension_param]
) }}
You can get even more sophisticated by adding multi-value parameters and/or using parameter actions to the queries that are sent from Tableau to the dbt semantic layer. I’ve recorded a couple of demos that walk through how to set-up the semantic layer connection using the Jaffle Shop Metrics dbt project (source code and Tableau workbook are available on my github repo here):
Tableau & dbt Semantic Layer Demo (4 minutes)
Tableau & dbt Semantic Layer Demo (16 minutes)
Summary
In summary, dbt & Tableau are hugely complimentary products and using them effectively together is providing the best of both worlds by helping organisations achieve the right balance of governance and self-service. Please drop into the #tools-tableau slack channel in the dbt workspace to join the conversation and find out more!

